Table of Contents
- Overview
- Core Components
- Administrator Hierarchy and Permissions
- Device and Traffic Visibility
- Getting Started
- API and Automation
- Security and Compliance
- Conclusion
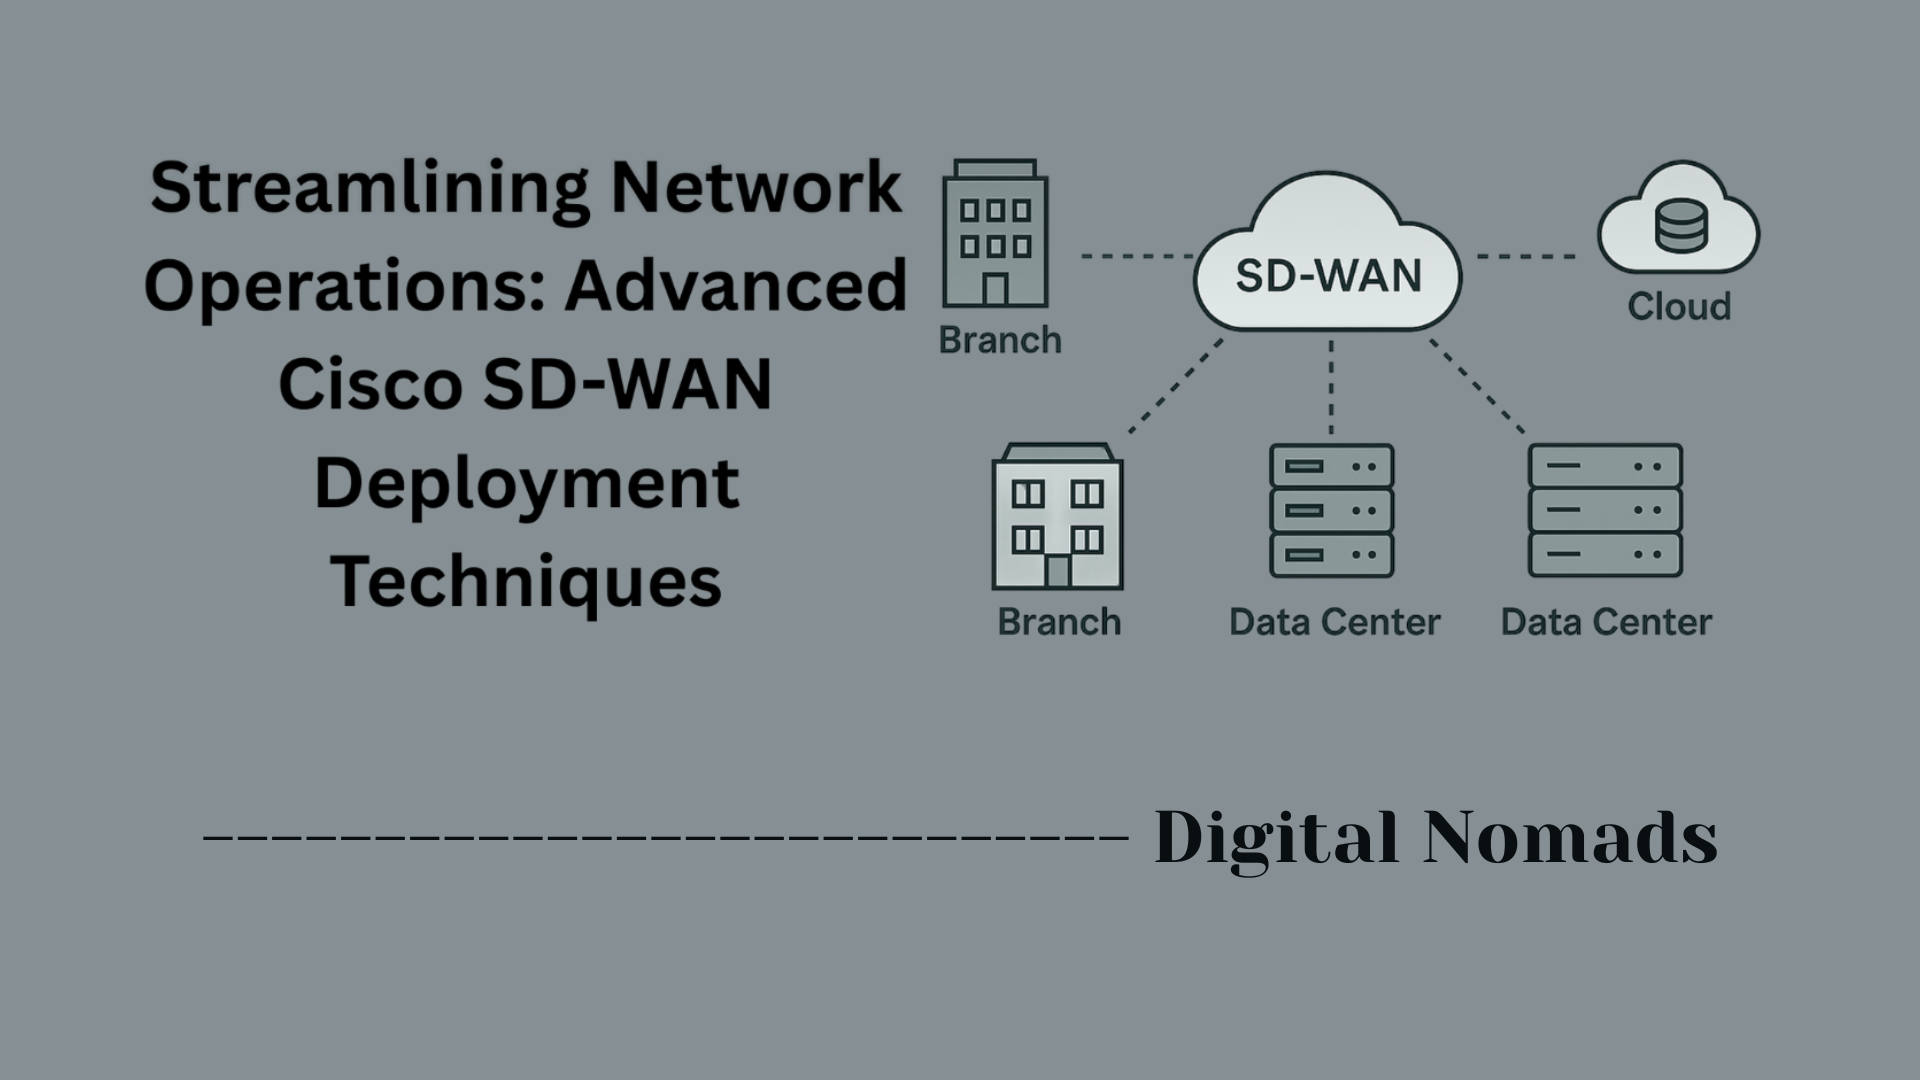
Cisco Meraki: Meraki Cloud Dashboard Overview
What is the Cisco Meraki Cloud Dashboard?
The Cisco Meraki Cloud Dashboard is a centralized, web-based platform for managing all Cisco Meraki networking devices, including wireless access points, switches, security appliances, cameras, and IoT sensors. It shifts the traditional model of on-premises network management into the cloud, offering a single interface for configuration, monitoring, and troubleshooting from anywhere with internet access.
Why Is It Important?
- Centralized Management: The dashboard gives IT teams full control over geographically distributed networks without the need for local controllers or physical site visits.
- Simplified Operations: Its intuitive interface reduces complexity, requiring less specialized knowledge for setup and troubleshooting.
- Scalability: Organizations can easily add new sites or devices, manage multiple networks, and enforce consistent policies everywhere.
- Security and Visibility: Built-in analytics and continuous monitoring provide actionable insights into device health, network performance, user activity, and security events.
- Reduced Costs: By leveraging cloud infrastructure, companies minimize the need for traditional hardware controllers and lower operational overhead.
How Does It Work?
- Cloud-First Architecture: Meraki devices automatically connect to the Cisco Meraki cloud once they have internet access. Configuration and policies are managed centrally in the dashboard and pushed out to devices over secure connections.
- Device Communication: Every Meraki device maintains an encrypted link to the cloud, enabling real-time status updates, telemetry, and remote troubleshooting tools.
- Role-Based Access: Multiple administrators can be assigned different permission levels to manage, view, or audit specific networks or the entire organization.
- Real-Time Monitoring: The dashboard displays live status, location, and usage metrics for each device, and offers detailed client analytics, bandwidth consumption, application visibility, and network topology maps.
- Automated Updates and Security: Firmware upgrades, security patches, and configuration changes are deployed seamlessly from the cloud without manual intervention, keeping networks resilient and protected.
In summary, the Cisco Meraki Cloud Dashboard transforms network management by making it more accessible, secure, and efficient—empowering organizations to focus on innovation rather than infrastructure maintenance.
Core Components
The core components of the Cisco Meraki Cloud Dashboard provide the foundation for centralized network management, enabling visibility, control, and security across multiple device types and locations.
- Cloud-Hosted Dashboard Interface: A web-based, cloud-hosted platform accessible from anywhere, providing a centralized place to monitor, configure, and troubleshoot all Meraki network devices without on-premises controllers.
- Meraki Devices: Includes wireless access points, switches, security appliances (MX), cameras, and smart sensors that connect and communicate with the cloud dashboard for management and reporting.
- Organization and Network Structure: An organizational hierarchy that allows administrators to group networks and devices logically by location or function, facilitating multi-site management and scalable administration.
- Role-Based Access Control (RBAC): Controls user permissions at both organization and individual network levels, enabling fine-grained user management and secure delegation of administrative duties.
- Real-Time Analytics and Alerts: Continuously collects telemetry from Meraki devices to offer live network insights, bandwidth usage, client details, application visibility, and proactive alerts for network events and issues. >
- Cloud API: A programmable RESTful API that enables automation, integration with third-party tools, and custom network management workflows using data and controls exposed by the dashboard.
Administrator Hierarchy and Permissions
The Cisco Meraki Cloud Dashboard uses a flexible administrator hierarchy to manage access at multiple levels. This structure enables organizations to securely delegate responsibilities across teams without compromising visibility or control.
- Organization Full Administrator: Has complete access to all networks within the organization. Can manage users, licensing, device claims, API keys, and organizational settings.
- Organization Read-Only Administrator: Can view all aspects of the organization's networks but cannot make configuration changes. Useful for auditors or view-only users.
- Network Full Administrator: Granted full control over specific networks. Can configure devices, apply policies, and manage network-specific settings without accessing other networks in the organization.
- Network Read-Only Administrator: Limited to viewing settings and monitoring activity within designated networks. Cannot make any changes to configurations or policies.
- Role-Based Access Control (RBAC): Enables fine-grained permission assignment. Organizations can tailor administrator roles to match operational needs while preserving security controls.
It is recommended to have at least two organization-level full administrators to prevent lockouts. All actions are logged for accountability, making it easier to audit changes and track activity per administrator.
Device and Traffic Visibility
The Meraki Cloud Dashboard offers complete, real-time visibility into all connected devices, users, and the flow of network traffic. This enables IT admins to monitor performance, identify issues, and optimize resource usage across the entire environment.
- Device Status Monitoring: View the live status of access points, switches, firewalls, and cameras. Each device shows connectivity health, uptime, and firmware version at a glance.
- Client Device Insight: Track every connected client with details such as IP address, MAC address, device type, operating system, and signal strength.
- Bandwidth and Usage Analytics: See how much bandwidth each client or application is consuming. Admins can sort traffic by user, device, app category, or time range.
- Application Visibility: Identify application-level traffic including cloud apps, streaming services, and social media. Classify apps by category for easier policy management.
- Network Topology Mapping: The dashboard automatically generates a real-time visual map of how devices are connected, including upstream/downstream relationships for easier diagnostics.
- Integrated Troubleshooting Tools: Tools such as remote ping, cable test, port cycle, and event logs are built directly into the interface for fast issue resolution without needing on-site access.
This deep level of visibility empowers administrators to detect anomalies, prevent network congestion, and maintain optimal performance across all sites.
Getting Started
Getting started with the Cisco Meraki Cloud Dashboard is a streamlined process that allows organizations to quickly deploy, configure, and manage their network infrastructure from a central location. Follow these steps to begin your Meraki journey:
- Create a Meraki Dashboard Account: Visit the Meraki Dashboard portal and sign up for an account. This account will serve as your administrative hub for managing all Meraki-enabled devices and services.
- Set Up Your Organization and Networks: Define your organization's name and create one or more networks based on your locations or segments (e.g., branch office, data center, Wi-Fi).
- Claim Devices and Apply Licenses: Use the "Add Devices" option to enter your device serial numbers or Meraki order numbers. Make sure all required devices are assigned to their respective networks and that appropriate licenses are applied.
- Add Administrators and Define Permissions: Assign user roles based on responsibility. You can specify read-only or full access at both organization and network levels using Role-Based Access Controls (RBAC).
- Physically Connect and Power Devices: Plug in Meraki access points, switches, or firewalls at your site. Devices automatically reach out to the Meraki Cloud for configuration and updates once connected to the internet.
- Perform Initial Configuration: Log in to the dashboard and configure essentials such as SSIDs, VLAN settings, firewall rules, and device naming conventions.
- Optional – Use the Meraki Mobile App: Download the Meraki mobile app on your smartphone or tablet to onboard devices via QR code and monitor performance on the go.
- Monitor and Optimize: Use real-time analytics, alerts, and topology maps in the dashboard to ensure your network is performing optimally. Apply traffic shaping or access policies as needed.
By following these steps, administrators can quickly establish a secure and scalable network environment using Cisco Meraki’s cloud-first platform.
API and Automation
The Cisco Meraki Cloud Dashboard provides a powerful set of APIs that enable automation, integration, and custom workflows for network management. This empowers organizations to streamline operations, reduce manual work, and connect Meraki with third-party systems or custom tooling.
- RESTful Dashboard API: The cloud-native API allows programmatic access to virtually all aspects of the dashboard—such as device configuration, network monitoring, license management, and alert retrieval.
- API Key Management: Administrators can generate and revoke API keys from the dashboard. Keys inherit the permissions of the administrator account and should be kept secure as they do not expire by default.
- Automation and Scripting: Use scripts to automate repetitive tasks, perform bulk updates, or synchronize settings across multiple networks. Common automations include onboarding new devices, updating firewall rules, and generating reports.
- Integration with External Tools: The API supports integration with SIEM, ITSM, monitoring platforms, and custom dashboards to provide centralized insights and actionable alerts.
- Webhooks and Event Notifications: Configure webhooks to receive instant notifications about events like device connectivity changes, security alerts, or configuration updates, enabling real-time response and workflow automation.
- Developer Resources: Access official documentation, code samples, and a developer community to speed up integration efforts and share best practices.
By leveraging the Meraki API and automation features, organizations can enhance efficiency, enforce consistent policy, and adapt their network management to evolving business needs.
Security and Compliance
Security and compliance are foundational elements of the Cisco Meraki Cloud Dashboard, ensuring that networks meet strict standards for data protection, privacy, and regulatory requirements. Through automated updates, advanced threat defense, and comprehensive audit capabilities, Meraki equips organizations to confidently protect their infrastructure and sensitive information.
- Automated Firmware and Security Updates: Devices receive automatic patches and updates from the Meraki cloud, minimizing vulnerabilities and ensuring timely mitigation of emerging threats across the entire deployment.
- Advanced Threat Protection: Integrated security features include intrusion detection and prevention, malware scanning, content filtering, and layer 7 application firewalls to proactively block malicious activity.
- Data Encryption: All management traffic between Meraki devices and the cloud dashboard is encrypted using industry-standard protocols, safeguarding sensitive configuration and operational data.
- Role-Based Access and Audit Trails: Fine-grained permissions ensure that only authorized administrators can make changes. Every action is logged, creating a detailed audit trail to support compliance audits and investigations.
- Compliance Certifications: Meraki services adhere to rigorous compliance standards, such as ISO 27001, SOC 2 Type II, GDPR, and others, to help organizations meet industry-specific regulations.
- Comprehensive Logging and Retention: Event logs, configuration changes, and security alerts are securely retained and accessible for monitoring, reporting, and compliance verification.
With these security and compliance features, Cisco Meraki provides organizations with the confidence that their networks are resilient against threats and aligned with regulatory best practices.
Conclusion
Throughout this blog post, we’ve explored the power and simplicity of the Cisco Meraki Cloud Dashboard — a modern solution built for today's increasingly complex and distributed network environments. Whether you're managing a small office or a global enterprise, Meraki’s cloud-first approach offers unmatched visibility, control, and scalability.
Key Takeaways:
- Centralized Management: With the Meraki Dashboard, you gain a single pane of glass to manage all network devices — from access points and switches to security appliances and cameras.
- Core Components: The dashboard is built around a cloud-hosted interface, powerful analytics, scalable administration, and seamless integration with Meraki hardware.
- Role-Based Access Control (RBAC): It ensures the right people have the right access, enhancing security and organizational efficiency.
- Real-Time Visibility: Monitor devices, users, and applications with live insights and built-in troubleshooting tools.
- Quick Getting Started Process: Deployment is fast and intuitive — just claim your devices, configure settings, and you're ready to launch.
- API & Automation: Automate tasks, integrate with third-party systems, and build custom workflows using the Meraki Dashboard API.
- Security & Compliance: Stay protected with automated firmware updates, threat detection features, and support for key industry compliance standards.
Cisco Meraki simplifies networking without compromising power or flexibility. Whether you're a seasoned network engineer or a newcomer to IT, the dashboard gives you the tools to manage, secure, and scale your network with ease.
Thanks for following along, and happy networking! Feel free to share this post with your team or leave a comment with your own Meraki experiences! 🚀